It’s the first Wednesday of October which means it’s time for our monthly linky – Math IS Real Life!! If you want to see how the linky works, or just want other real world math ideas, check out our Pinterest Board of all the posts so that you can look back and find some great ideas and REAL pictures to use in your classroom!
If you are linking up, please include the below picture AND a link back to all four of our blogs – feel free to use the 2nd image and the links listed below!
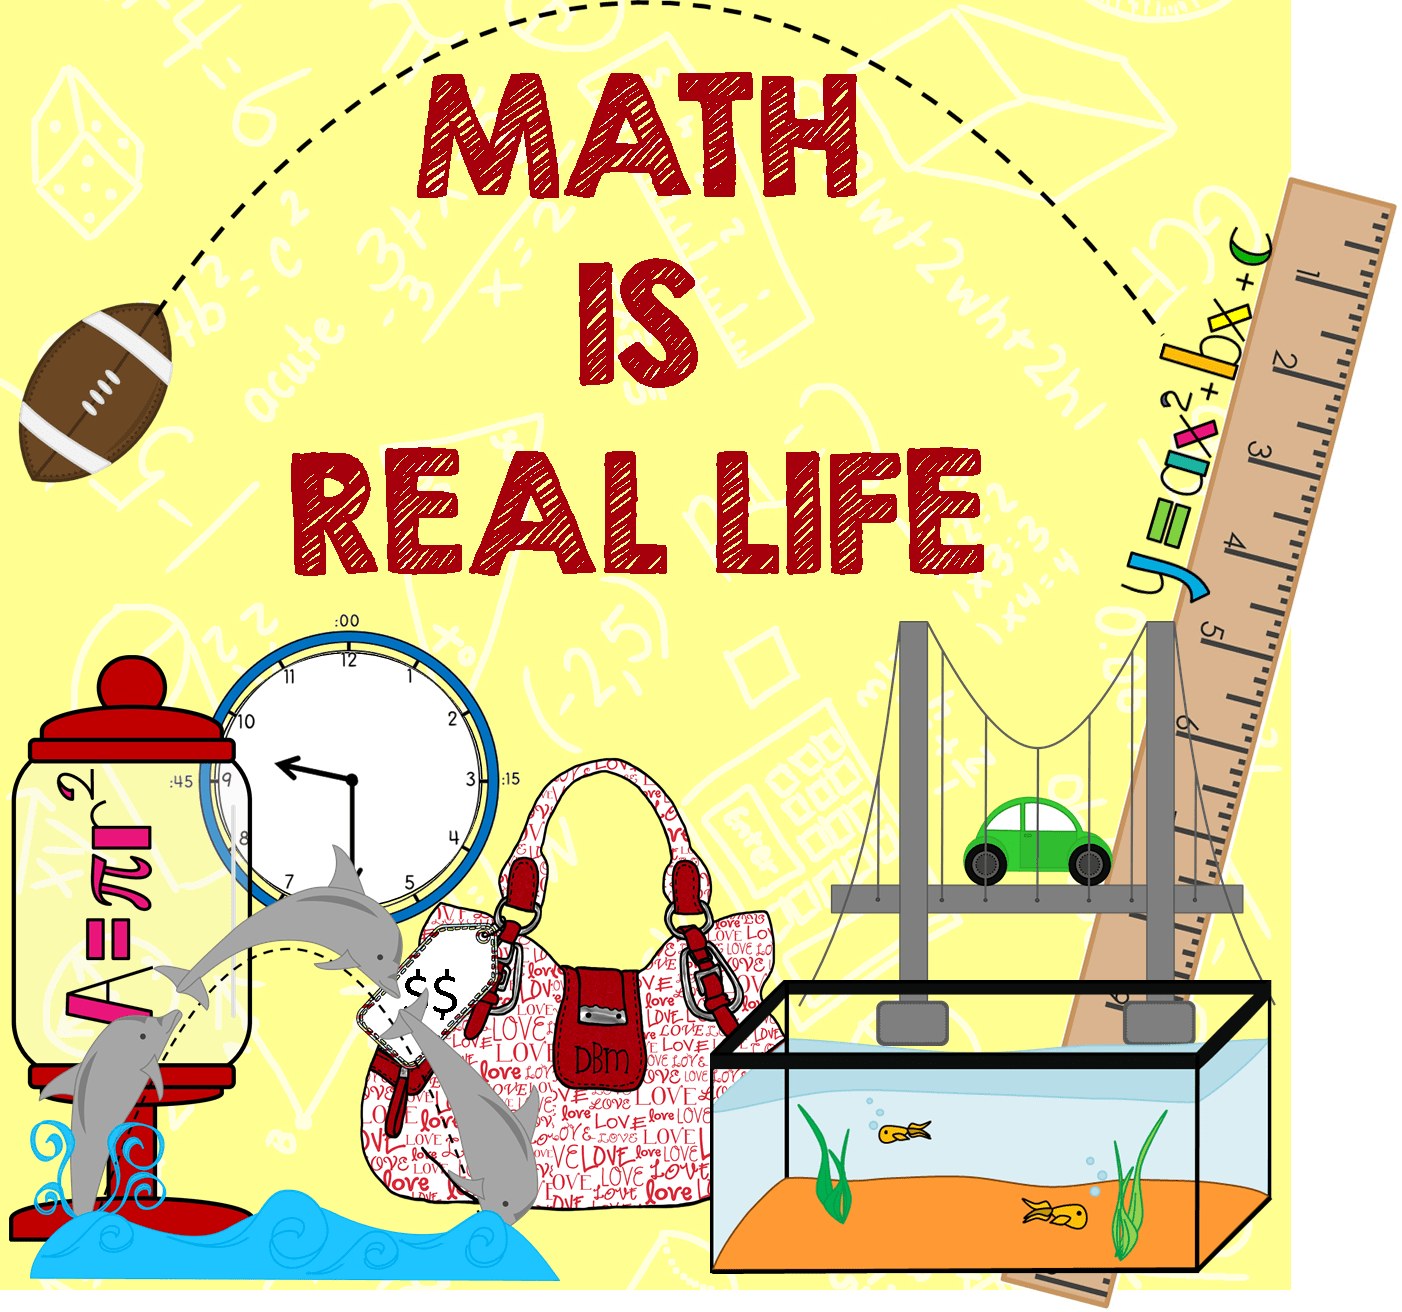
A monthly REAL WORLD math blog link-up hosted by

~*~*~*~*~*~*~*~*~*~*~*~*~*~*~*~*~*~*~
For those of you who have followed my blog for a while, you know that each year I do several projects sponsored by “Projects by Jen”, If you haven’t been to her site, I am right now telling you to go check it out. (Wait…finish my post first!)

For those of you who have followed my blog for a while, you know that each year I do several projects sponsored by “Projects by Jen”, If you haven’t been to her site, I am right now telling you to go check it out. (Wait…finish my post first!)
Every fall I participate in her “Oreo Project”, an international project where students stack Oreo cookies, collect class data, submit the data to the project, and can track the real time progress of the numbers as they roll in! Here are the results as of last Friday:
So…it is GREAT fun to see the “Real World Numbers” roll in and know we are a part of the data! Here’s how it went down.
 |
| First we went over the rules and each child got their turn to stack during math workshop. |
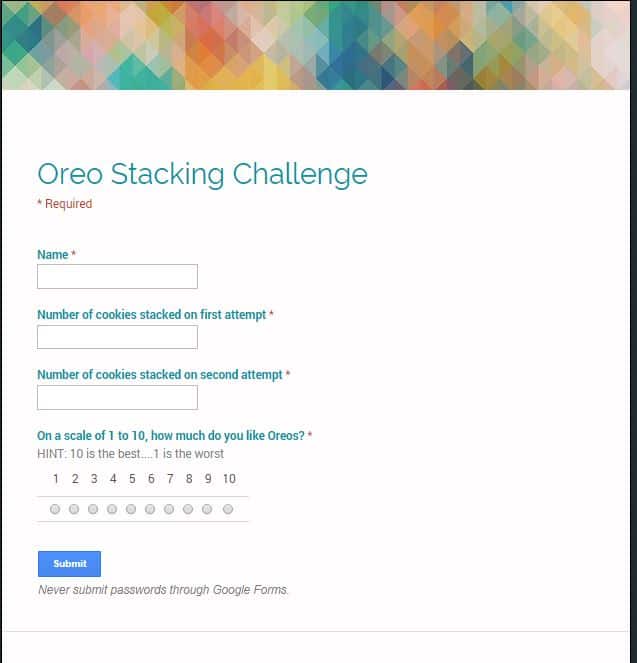 |
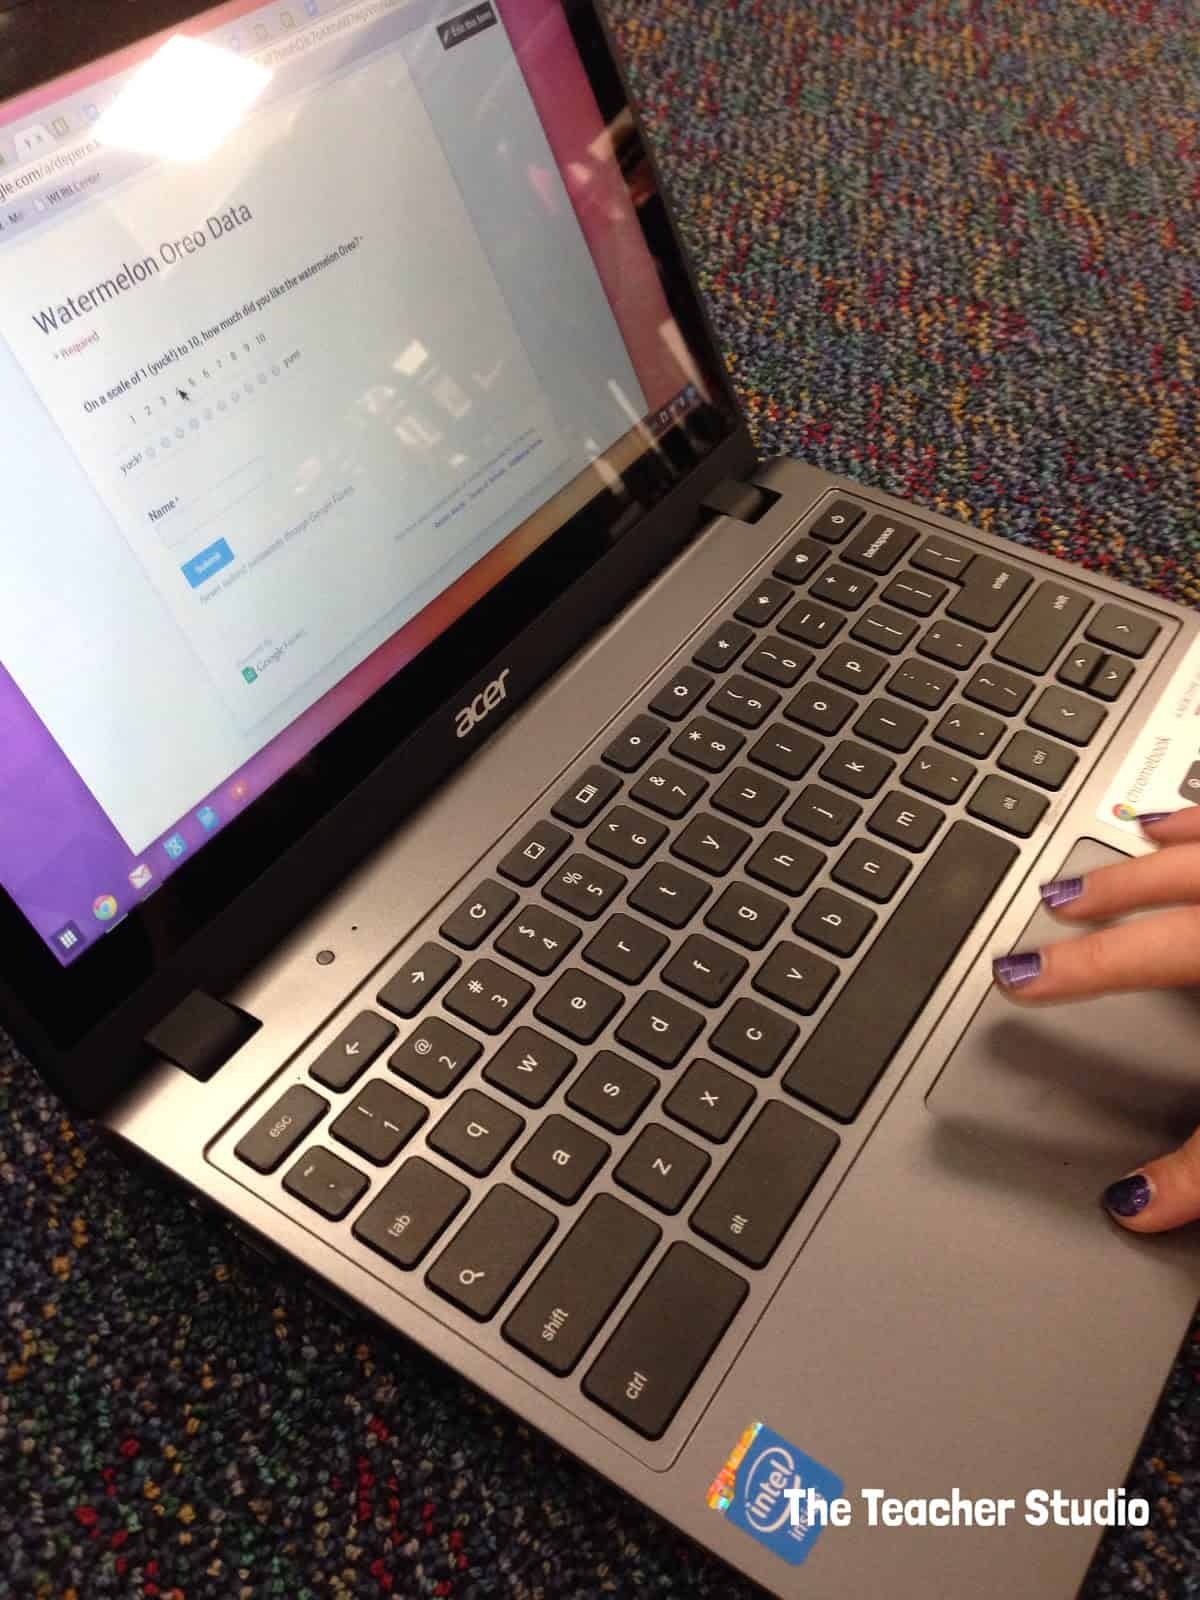
| I had a Chromebook nearby and each student filled out a Google form to record their results. |
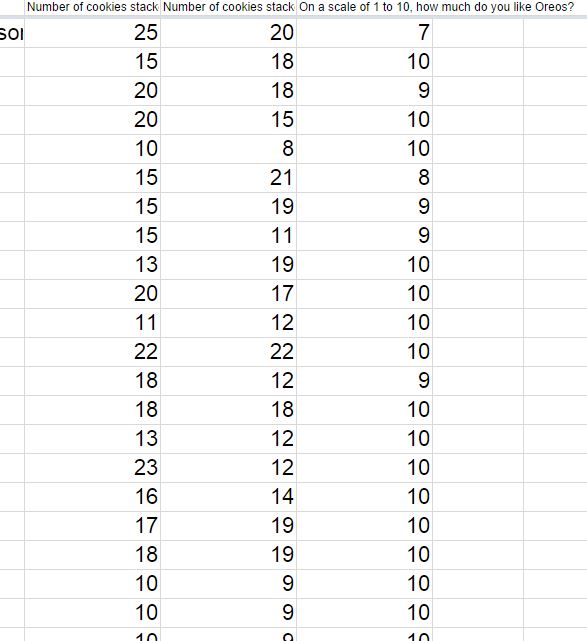 |
| At the end, I printed off the spreadsheet (without student names) and asked a small group of students to identify the highest number for each student and then to compute the average so we could submit it to the project. |
BUT WAIT! There is MORE real world math! I wanted to really help students understand that we can collect data on countless things–and that certain data can be very useful! Is the average number of Oreos that can be stacked critical in the world? Maybe not…but there sure is a bunch of other Oreo data that might be interesting to people.
Oreo has a bazillion flavors now. Did you know that?
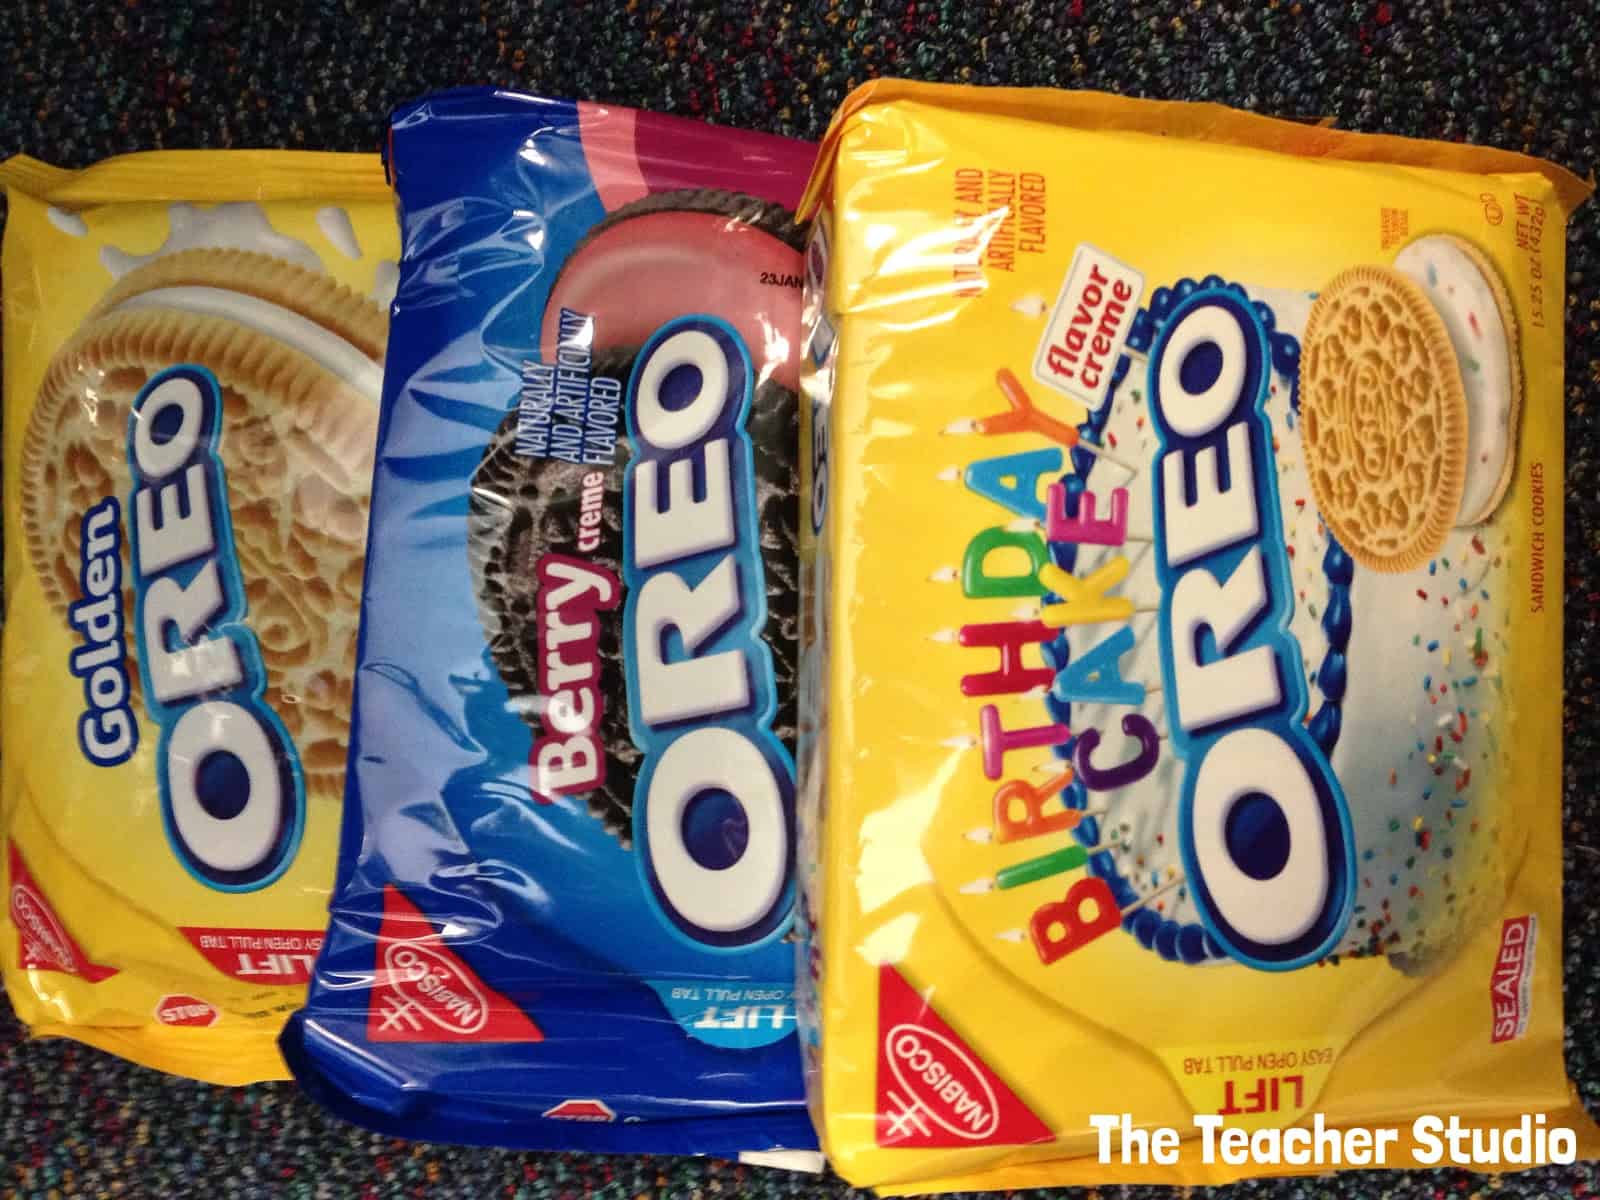 |
| Here are just a few. |
So I thought it would be fun to do some taste testing and data collection. We started with the mint Oreos (I gave mine a “10”) and moved to the watermelon Oreos (I gave mine a 3.)
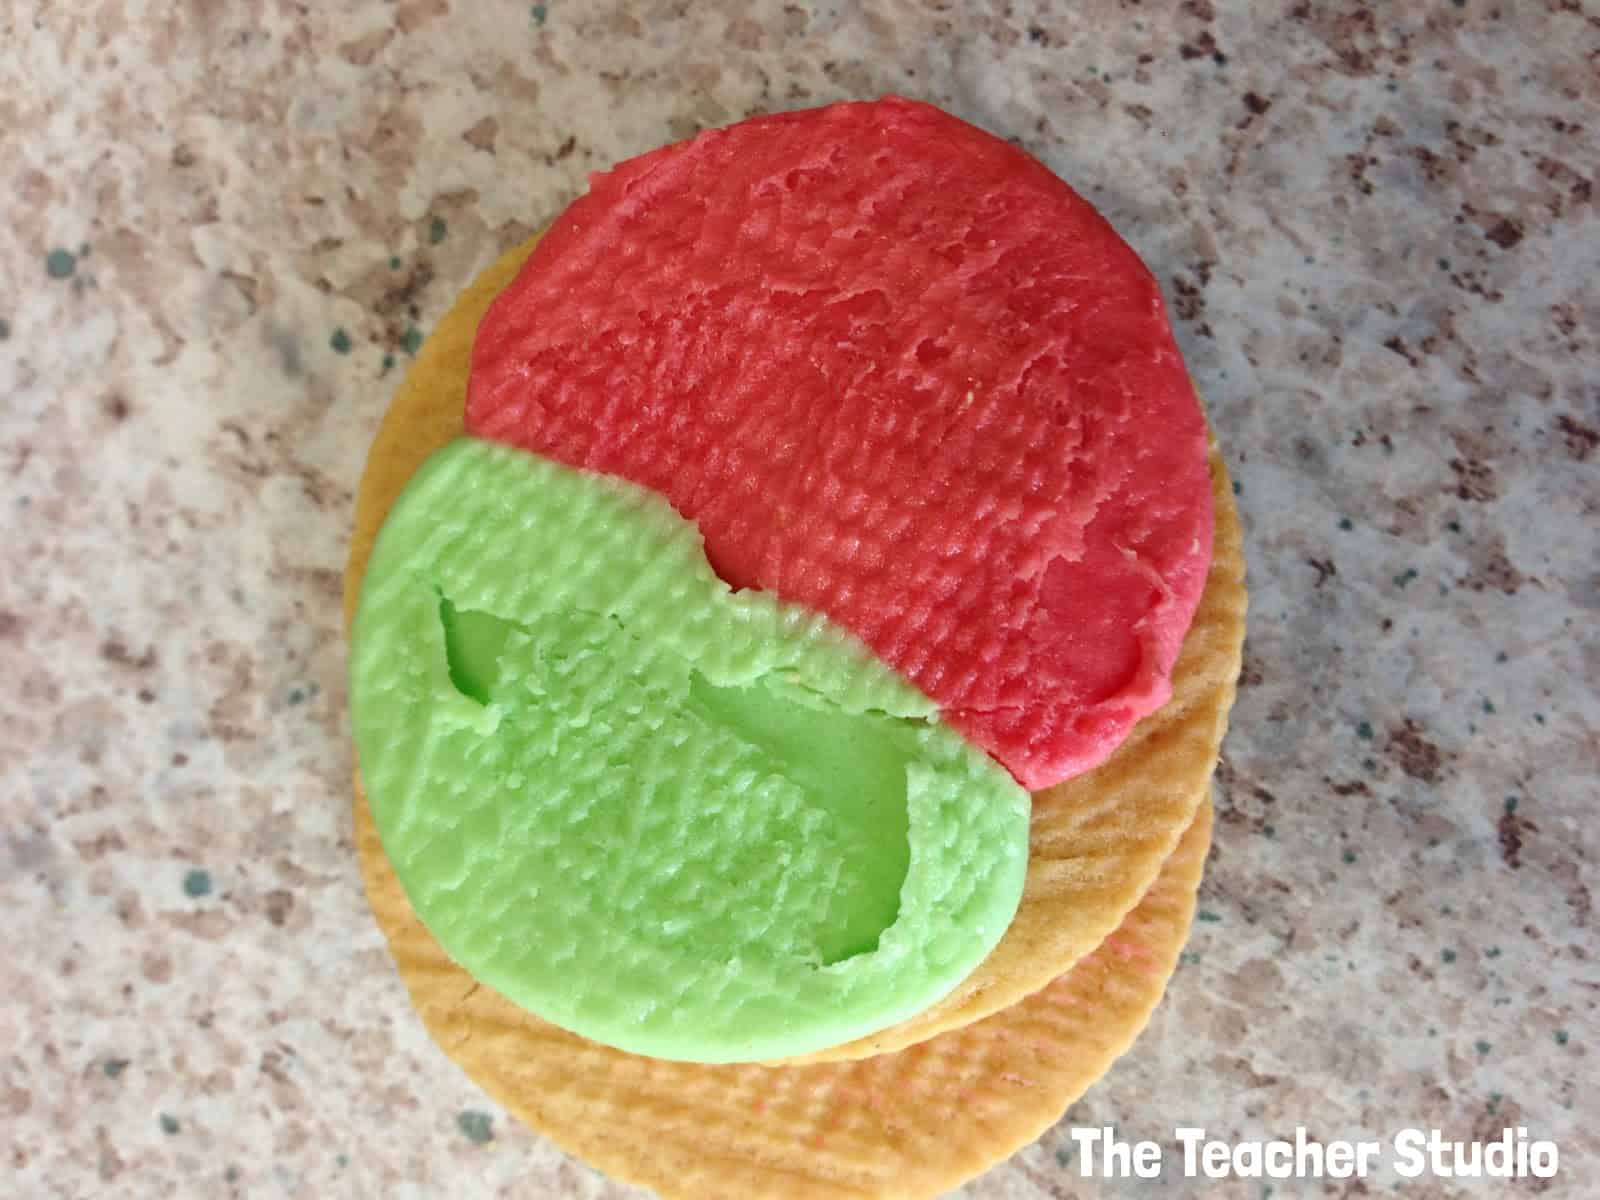 |
| Seriously. Does this look like a good idea to you? |
I wanted the students to see that we can collect data in a lot of ways…so we passed around a graph for students to fill in as they ranked their mint Oreo.
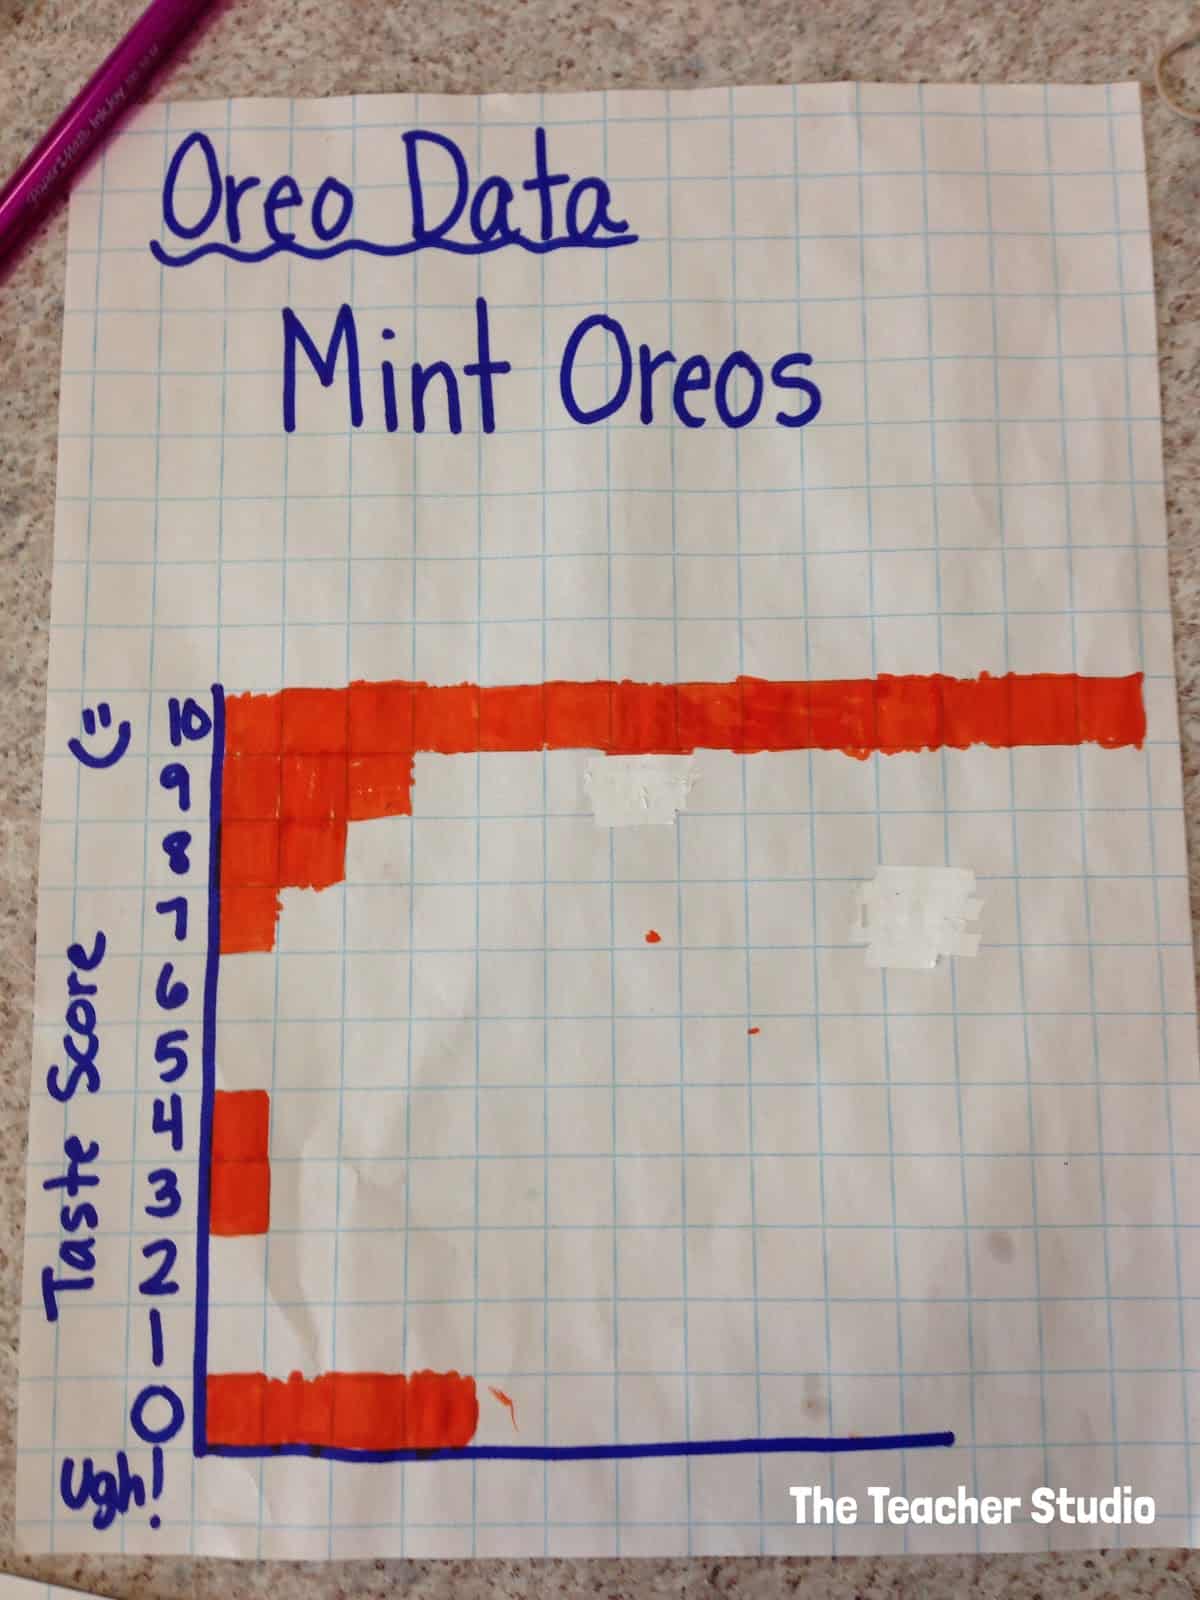 |
| Is it beautiful? No. Can we tell something at a glance–YES. We can tell that the mint Oreos were a big hit! We also could tell that some other students had very strong negative feelings. We also noted the “boo boo” tape and that hand making graphs is a dangerous business! |
So we moved up in the world for the watermelon Oreos and used a Google form.
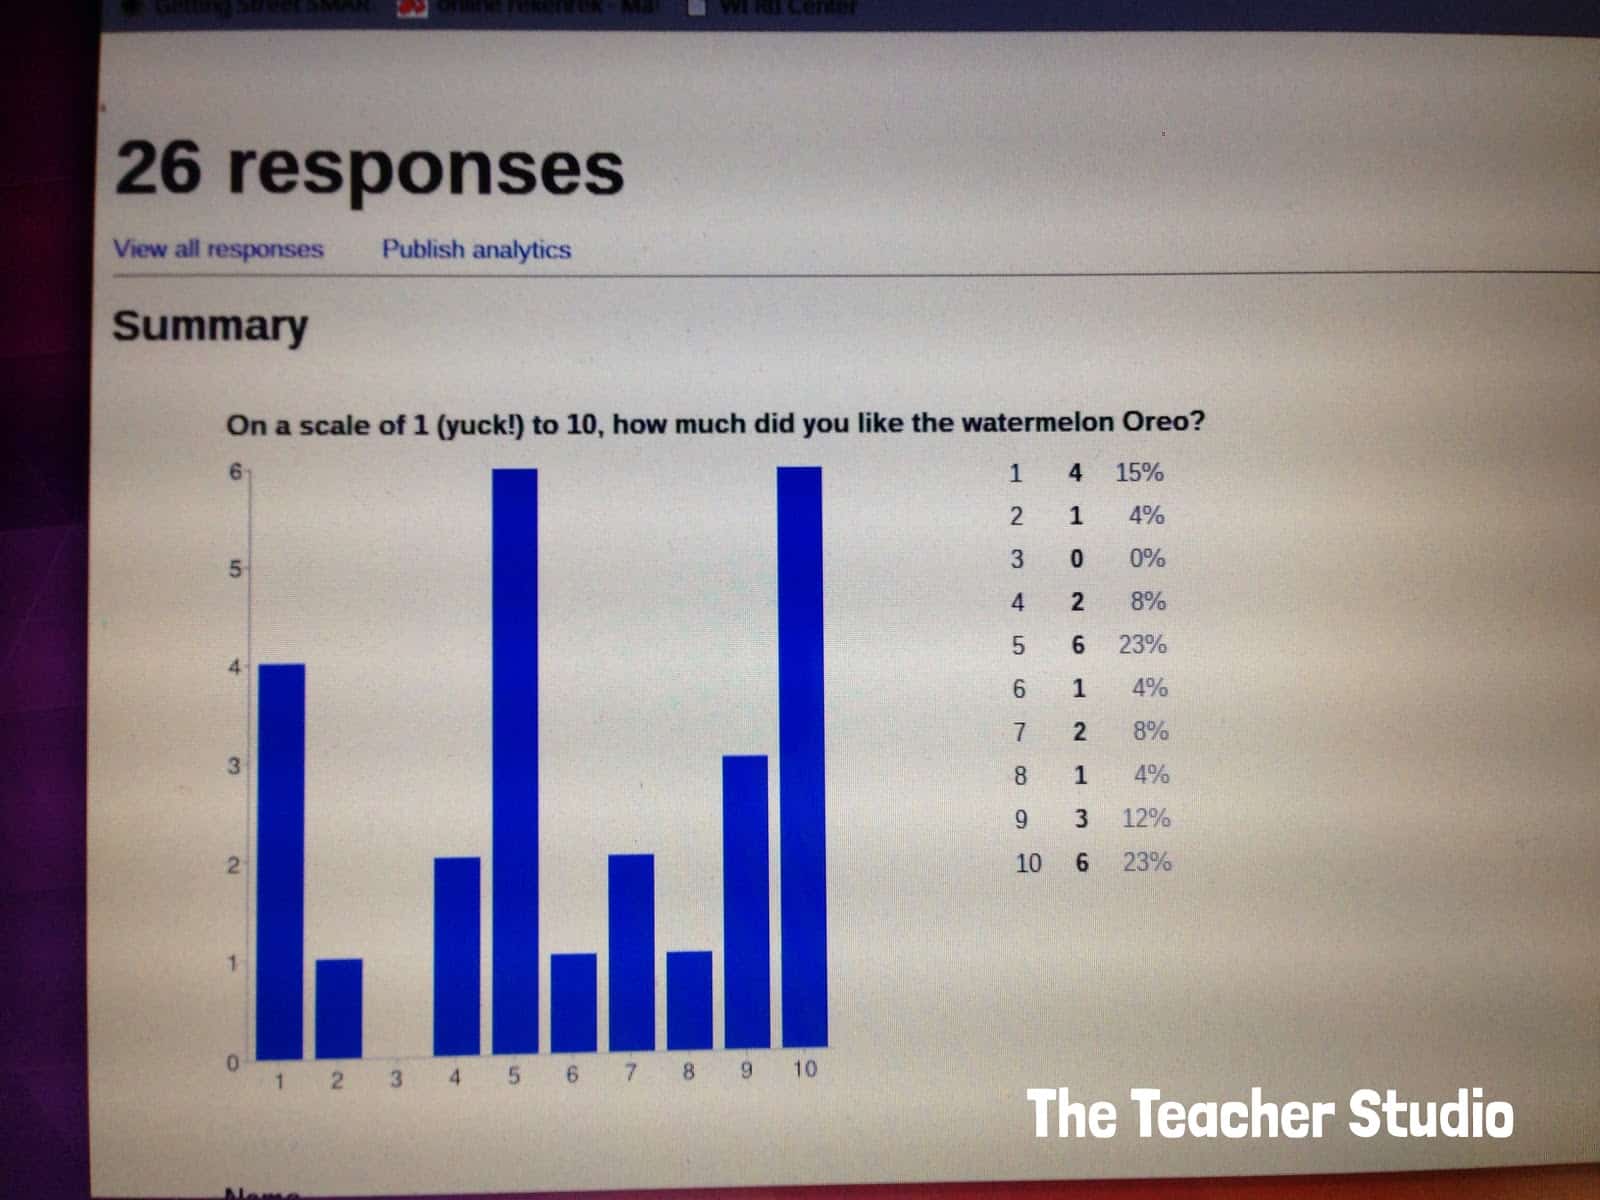 |
| Now THAT’S a graph! So neatly done…and we made some pretty astute observations. |
So who cares? Does Nabisco care about this kind of data! You bet! They need to judge the success of their different flavors. Do stores care? You bet! They want to make educated decisions about how many of each kind of Oreo to buy. We talked about how the ideas of 26 people might not matter to them…but if they could get information from hundreds or thousands–they really could use that information to make decisions.
It’s a great kick off to our supplemental graphing unit, and I cannot WAIT to use my new “Great Graphs” resource to REALLY get my students thinking about the “real life” implications of data. If you haven’t checked out Projects by Jen…this would be the time to do it!
Don’t forget to check out the other MIRL posts below! Check back over the next few days – more will be added!!
~*~*~*~*~*~*~*~*~*~*~*~*~*~*~*~*~*~*~