Updated! Read to the bottom for more!
We continued our work yesterday with line plots and dug in a little deeper to collect some “real” data! I set the class up in three stations . . .
1. Read and interpret a line plot with a partner
2. Collect data on standing broad jumps–measured to the nearest 1/2 foot–and add to a line plot
3. Collect data on “Giant Puff Ball Blowing”–measured to the nearest 1/2 cm–and add to a line plot
I split the class into heterogeneous groups of 7-8 and sent one to each station. They spent about 8 minutes at each after an initial 5 minute overview of expectations and techniques. Station 1 was independent, station 2 had our inclusion teacher standing by, and I was at station 3 (although it certainly could have been done in partners without a teacher).
Here’s how each station unfolded . . .
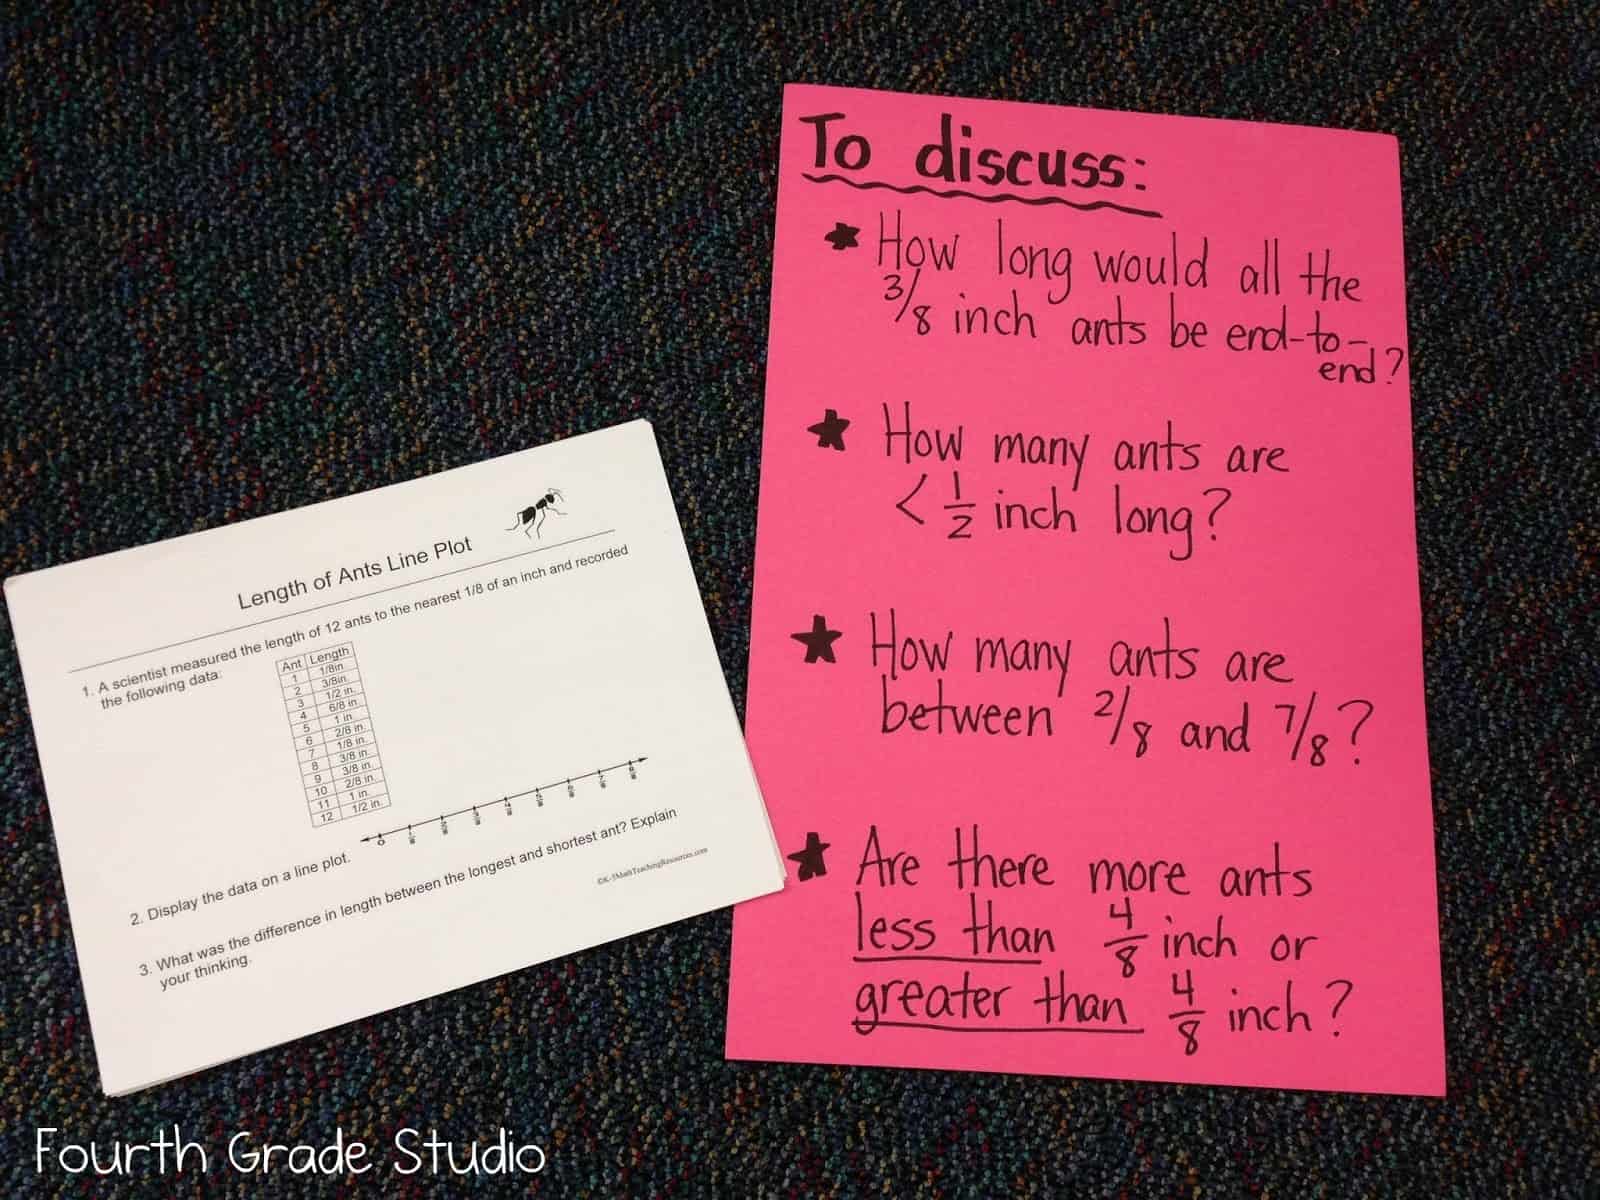
This station was the easy one! They had a simple cart showing the lengths of a bunch of different insects and asked them to create a line plot with the data. I, then, added the pink sheet of questions to work on with their partners. Students had no trouble with this one at all! These are the types of questions we have seen on some different assessment tasks, so I was glad to give them a little exposure to it.

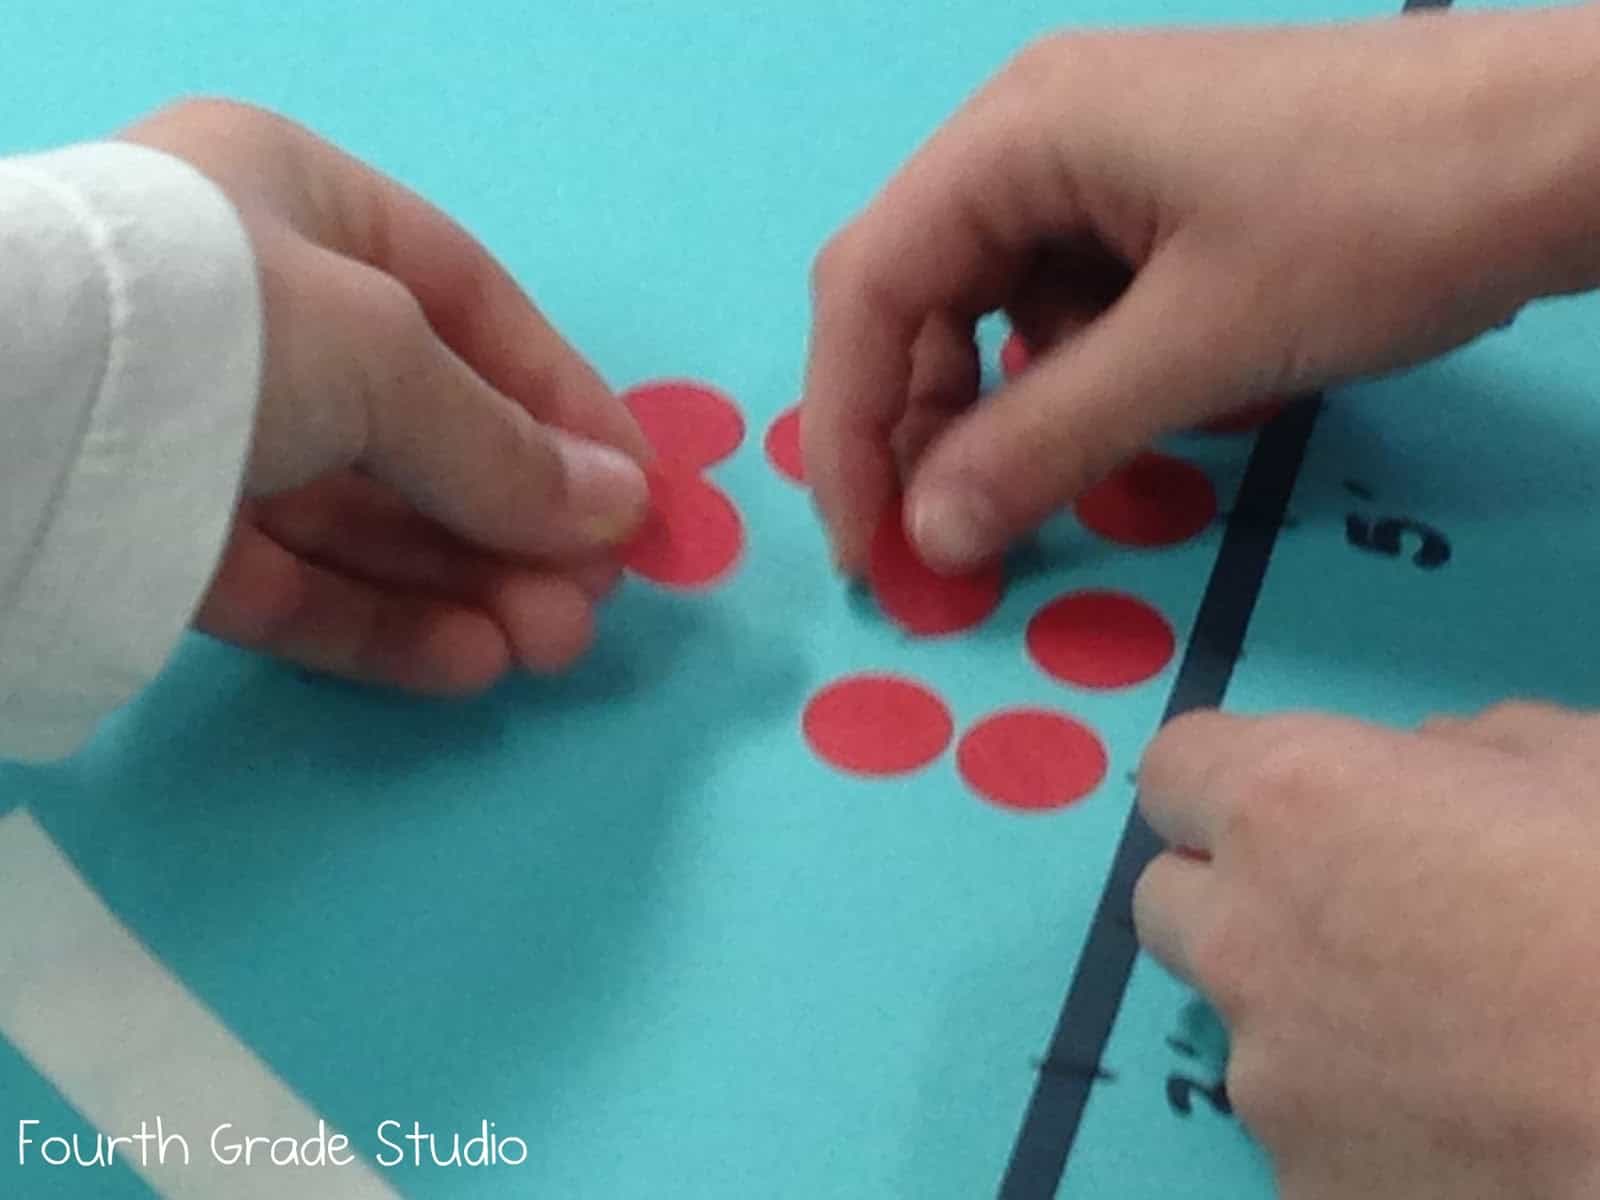
This was a big hit! We gave the students a practice jump to learn how to do it–and then they had two attempts. They put a sticky dot on a line plot to represent their best attempt to the nearest 1/2 foot.
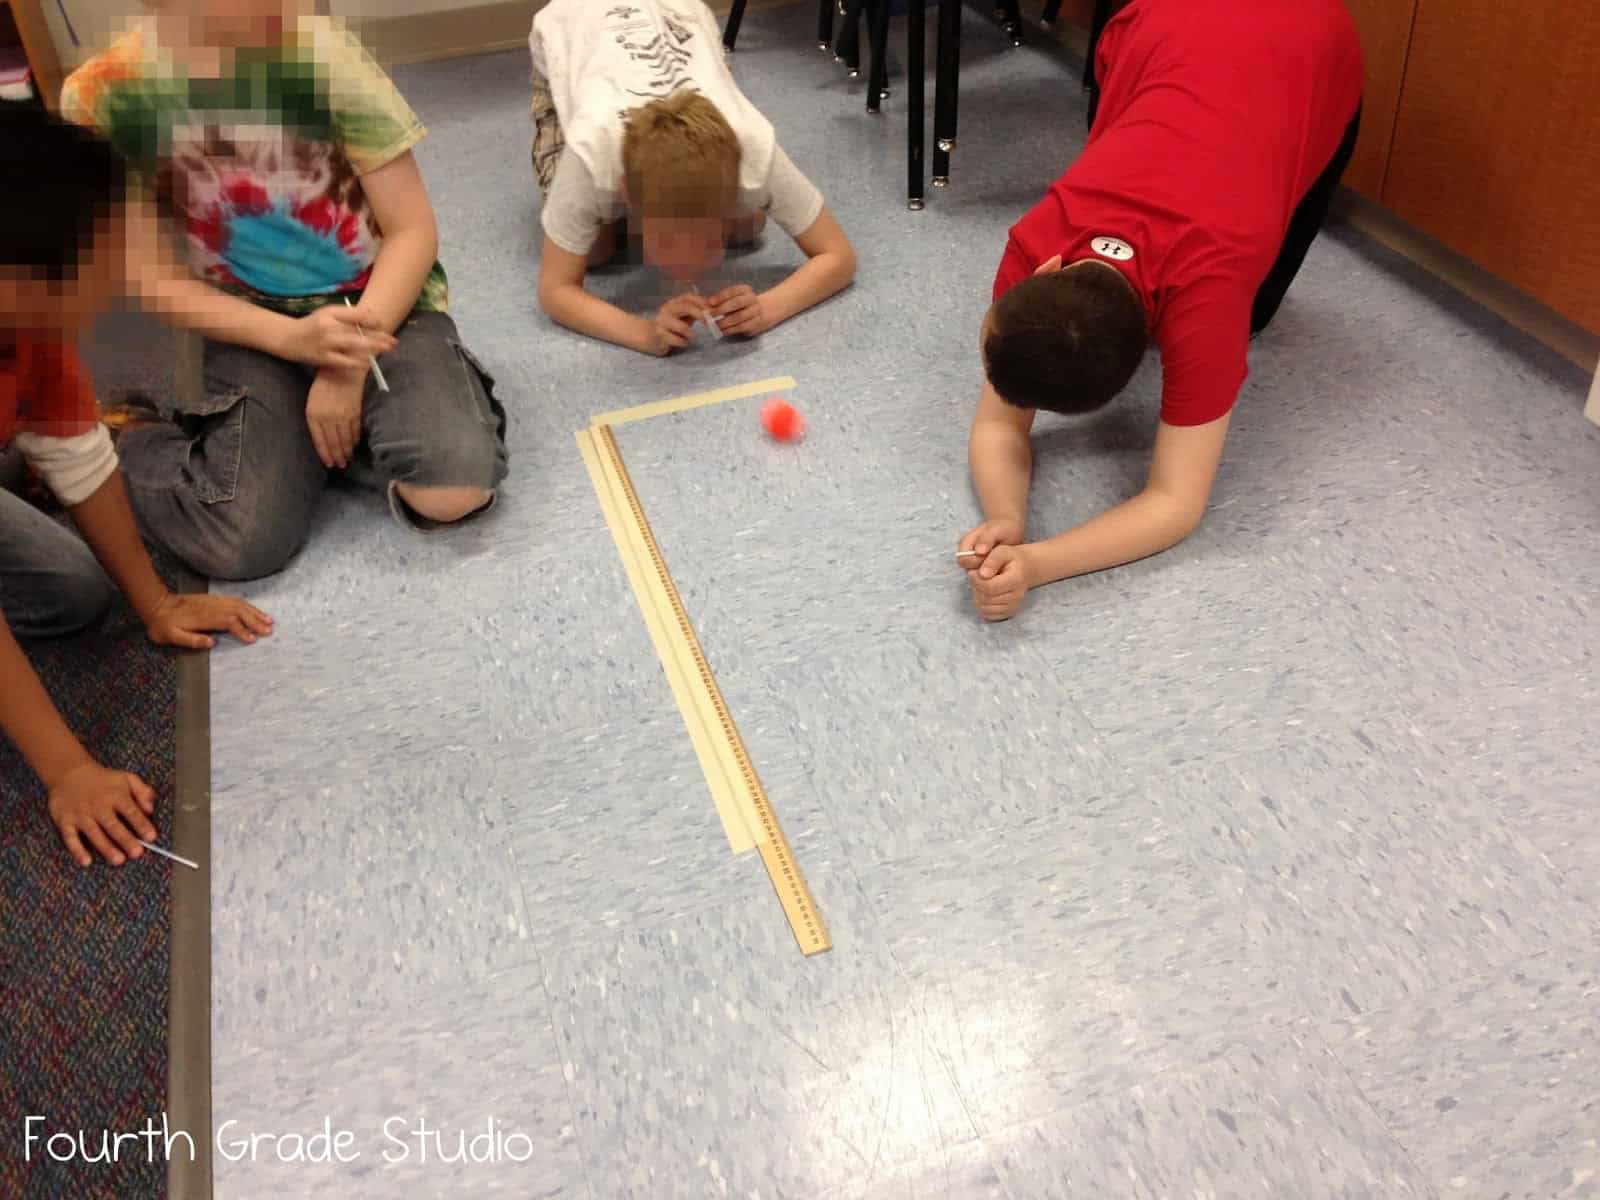
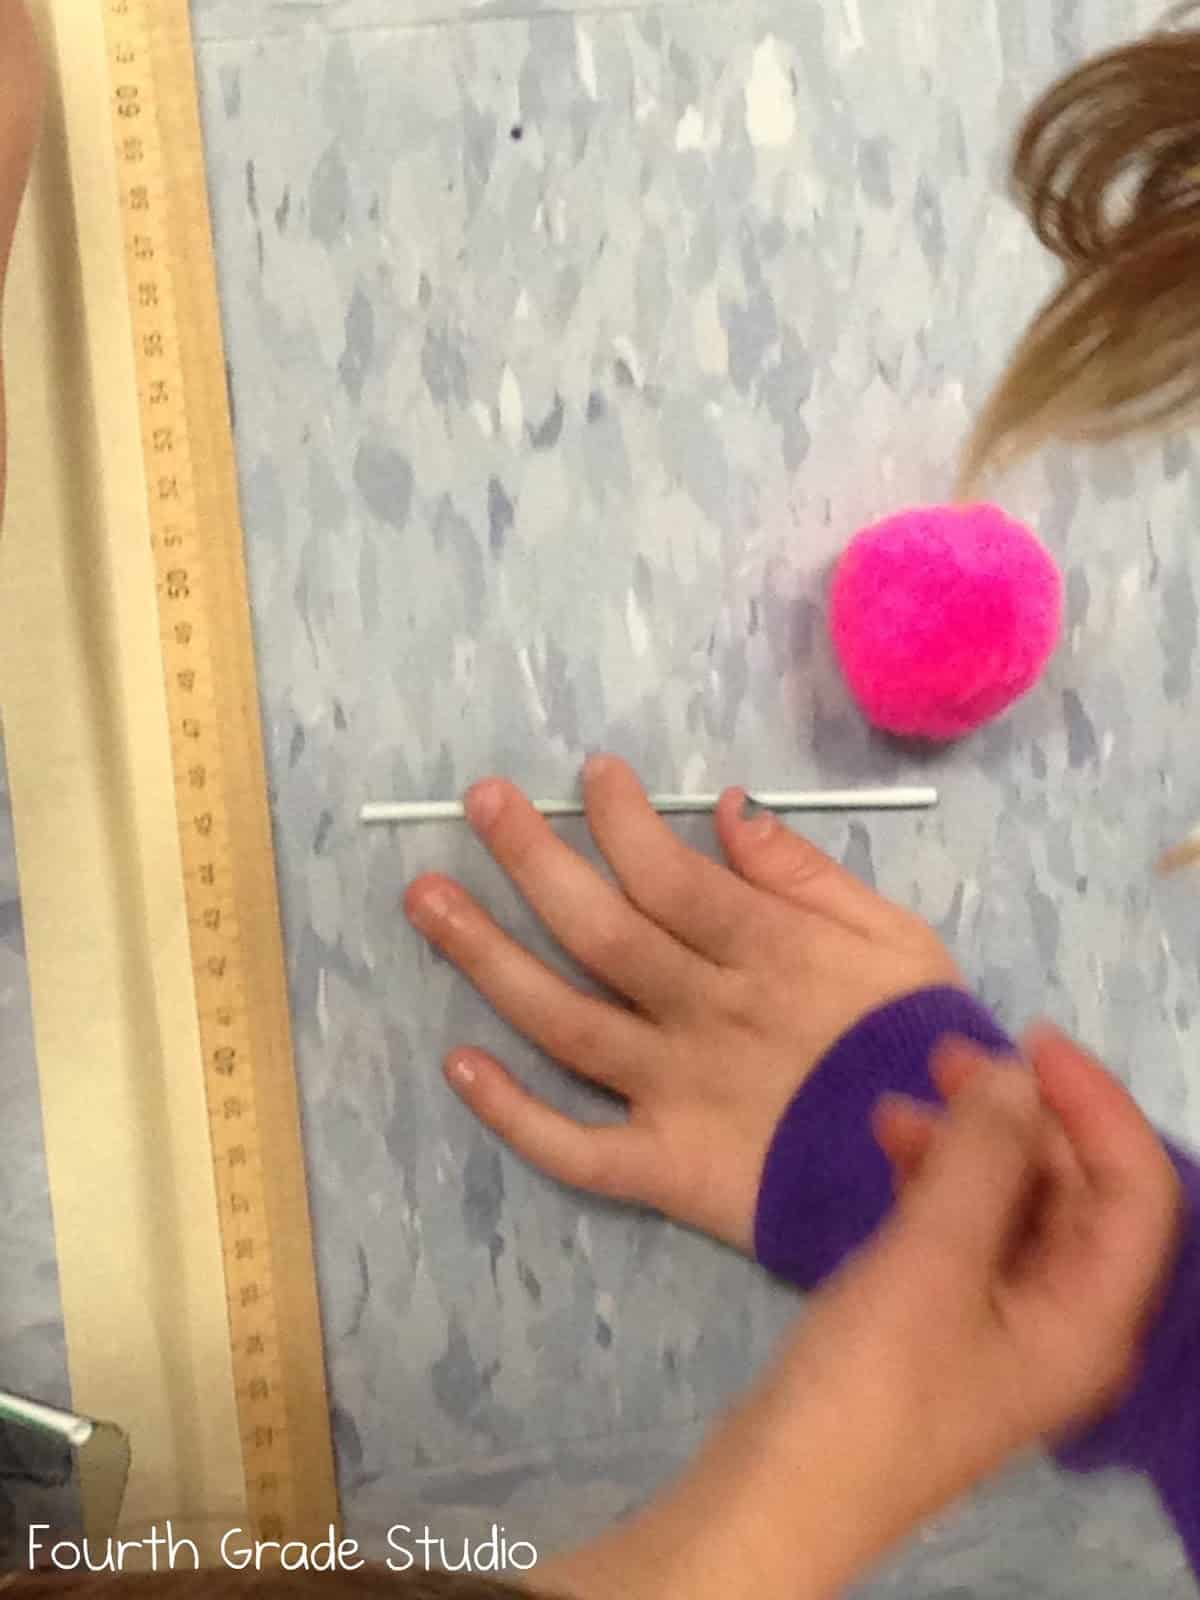
The final station was the “Giant Puff Ball Blow” where we took a giant pom pom and a skinny straw. Students had 2 attempts to take one big puff and blow the pom pom and measure to the nearest 1/2 cm. Students worked in partners and used their straw to line up the back end of their puff ball to get the closest possible measurement. They then put a sticker on the REALLY long line plot.
What do we notice about our line plots?
So after we collected our data we got back together as a large group and began to discuss what we noticed. The students did all sorts of great detective work–from finding minimum, maximum, range, mode, and median to talking about how far apart the data was from the puff ball blowing (LOTS of great hypotheses!) and how packed together the broad jump data was!
It was a fun and easy hour of math–and I think the students have a good grasp on line plots and interpreting them! Happy Friday, everyone!
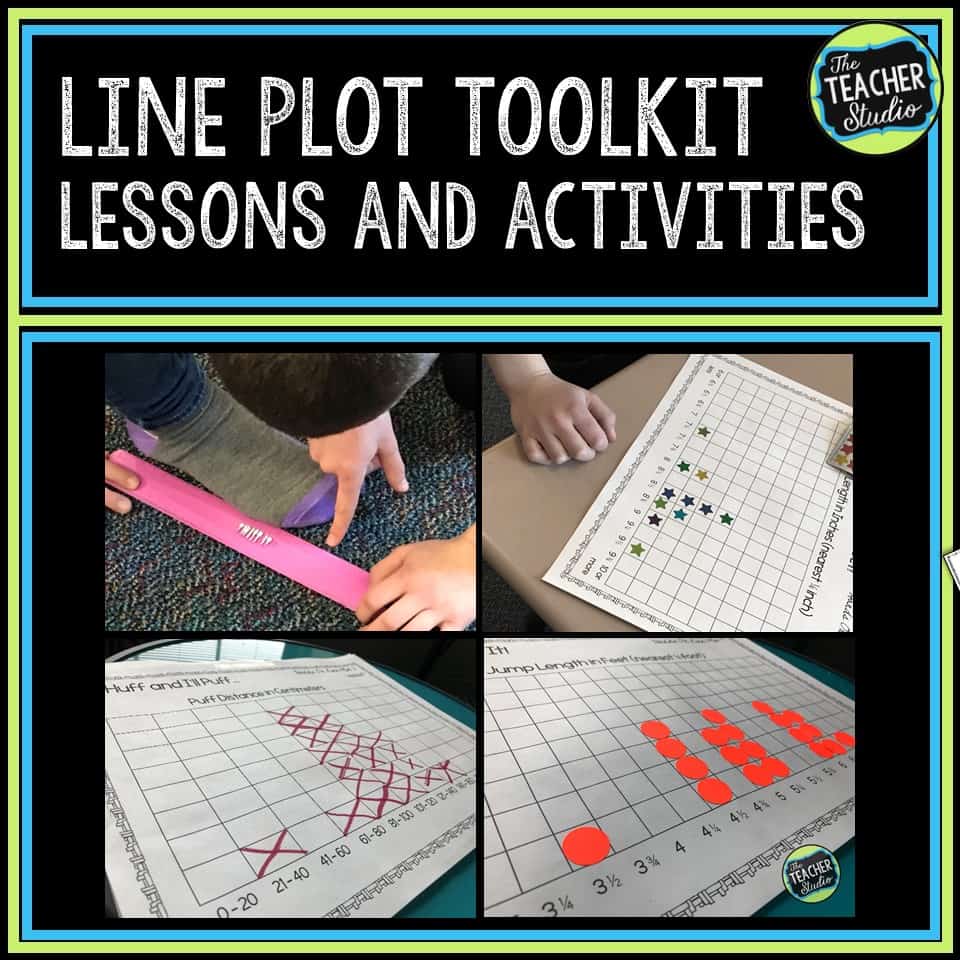
UPDATE! Due to popular request, several of these activities and MANY MORE have been put together into a low ink, ready-to-print resource for you! Just CLICK HERE or the image below for tons of line plot help!
Want a more detailed blog post about line plots? JUST CLICK HERE!
Rather pin it later?